Email Benchmarks, January - June 2021
See how you compare.
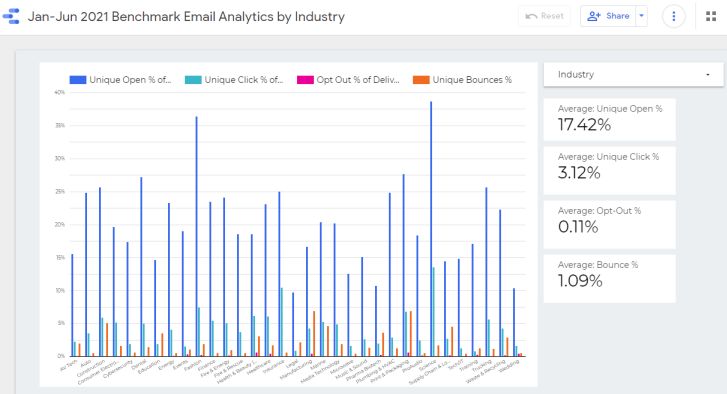
Many email marketers are left to wonder how their open rates compare to others in their industry. To help them better understand their analytics, we have compiled email statistics by industry. While the content and time of send does impact these somewhat, they are a good benchmark to see where your open rates are compared to others in your industry.
Ability to filter based on industry is provided.
To refine the industries shown in the report, simply click on the down arrow to the right of the Industry box in the upper right hand corner, click on the check box to clear all industries, then select the industries you wish to see on the report.
What does this tell me?
We have seen that those that have a higher “opt in” rate for their lists tend to have higher open and click rates. Another factor in open rates is how often you refine your list to remove those that are not engaging with your content. Studies have shown that regular maintenance will result in higher open rates.
Let’s see how the first half of 2021 looks: click HERE.
Compare to the second half of 2020: click HERE.
Click HERE to check out our data for the entire year of 2020.
Contact us at support if you have any questions.